Buildbot/Talos/Profiling: Difference between revisions
No edit summary |
(Redirected page to TestEngineering/Performance/Talos/Profiling) |
||
| (13 intermediate revisions by 3 users not shown) | |||
| Line 1: | Line 1: | ||
#REDIRECT [[TestEngineering/Performance/Talos/Profiling]] | |||
= How to Run Talos in Profiling Mode = | = How to Run Talos in Profiling Mode = | ||
When profiling is enabled, we use the [https://developer.mozilla.org/en-US/docs/Mozilla/Performance/Profiling_with_the_Built-in_Profiler Gecko Profiler] to capture profiles during each Talos run that can then be displayed by [https://perf-html.io perf.html]. The captured profiles are grouped into zip files, one per Talos test, which are placed into the upload directory. | |||
== On [https://wiki.mozilla.org/Build:TryServer TryServer] == | |||
1. When you push to try, add "mozharness: --gecko-profile" after "try: ..." to your commit message. Example: | |||
try: -b o -p macosx64,win32,win64 -u none -t all[10.6,10.8,Windows XP,Windows 7,Windows 8] mozharness: --gecko-profile | |||
If you're using 'mach try fuzzy' to push to try, simply add the '--gecko-profile' argument: | |||
./mach try fuzzy --gecko-profile | |||
2. When the test(s) finishes, select the job on treeherder, and click on the 'Job Details' tab. You will see the resulting talos 'profile_*' artifacts listed, with a link beside each one, to open it in [https://perf-html.io perf-html.io].] | |||
[[File:Talos profiling artifacts screenshot.png|800x461px]] | |||
== | == When running Talos locally == | ||
If you're running Talos using <code>mach talos-test</code>, you only need to append <code>--gecko-profile</code> to the command and the rest should happen automatically. | |||
< | After the Talos run is done, you will have a zip file with multiple profiles in your Talos "upload dir", which is, by default, at <code>testing/mozharness/build/blobber_upload_dir</code>. | ||
Talos will automatically launch Firefox and load the latest talos gecko profile in [https://perf-html.io perfhtml.io]. To turn this feature off, just set the DISABLE_PROFILE_LAUNCH=1 env var. | |||
If auto-launch doesn't work for some reason, just start Firefox manually and browse to [https://perf-html.io perfhtml.io], click on "Browse" and select the talos profile zip file noted above. | |||
If you're on Windows and want to profile a Firefox build that you compiled yourself, make sure it contains profiling information and you have a symbols zip for it, by following the [https://developer.mozilla.org/en-US/docs/Mozilla/Performance/Profiling_with_the_Built-in_Profiler_and_Local_Symbols_on_Windows#Profiling_local_talos_runs directions on MDN]. | |||
= FAQ = | = FAQ = | ||
Latest revision as of 16:02, 6 August 2019
Redirect to:
How to Run Talos in Profiling Mode
When profiling is enabled, we use the Gecko Profiler to capture profiles during each Talos run that can then be displayed by perf.html. The captured profiles are grouped into zip files, one per Talos test, which are placed into the upload directory.
On TryServer
1. When you push to try, add "mozharness: --gecko-profile" after "try: ..." to your commit message. Example:
try: -b o -p macosx64,win32,win64 -u none -t all[10.6,10.8,Windows XP,Windows 7,Windows 8] mozharness: --gecko-profile
If you're using 'mach try fuzzy' to push to try, simply add the '--gecko-profile' argument:
./mach try fuzzy --gecko-profile
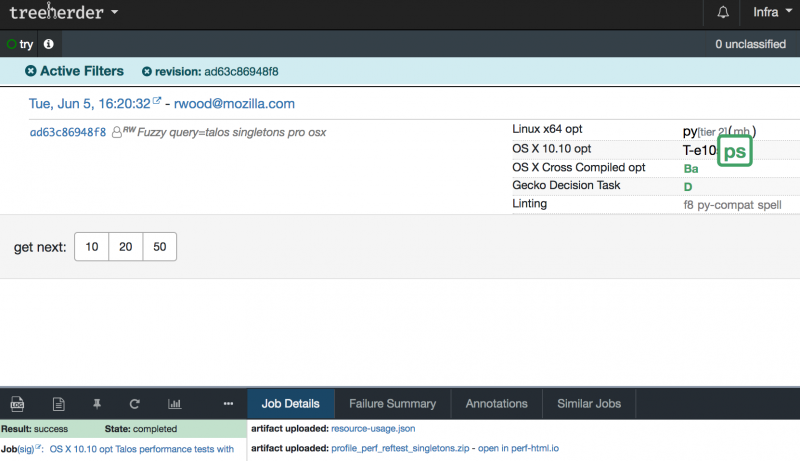
2. When the test(s) finishes, select the job on treeherder, and click on the 'Job Details' tab. You will see the resulting talos 'profile_*' artifacts listed, with a link beside each one, to open it in perf-html.io.]
When running Talos locally
If you're running Talos using mach talos-test, you only need to append --gecko-profile to the command and the rest should happen automatically.
After the Talos run is done, you will have a zip file with multiple profiles in your Talos "upload dir", which is, by default, at testing/mozharness/build/blobber_upload_dir.
Talos will automatically launch Firefox and load the latest talos gecko profile in perfhtml.io. To turn this feature off, just set the DISABLE_PROFILE_LAUNCH=1 env var.
If auto-launch doesn't work for some reason, just start Firefox manually and browse to perfhtml.io, click on "Browse" and select the talos profile zip file noted above.
If you're on Windows and want to profile a Firefox build that you compiled yourself, make sure it contains profiling information and you have a symbols zip for it, by following the directions on MDN.
FAQ
The Talos results with profiling are always higher, so how can I even use this?
Yes, profiling usually has non-trivial overhead. This is why you might want to try one of these approaches:
- Use Talos profiling only when you already know that there is a problem.
- Do a Talos run with profiling on before and after your change and compare those numbers.
- Do a Talos run with profiling off to check if the issue still exists and at the same time do a run with profiling on to get the data from it.
Why are the Windows tests sometimes hanging with profiling on?
There's a known issue with Talos profiling on Windows. See this bug.
I need to download all the profiles! Help!
Try this python script:
import urllib2
import json
from pprint import pprint
import re
from StringIO import StringIO
import gzip
import os
import sys

if len(sys.argv) < 2:
  print "usage:" , sys.argv[0] , "<try revision>"
  exit(1)

builds = json.loads(urllib2.urlopen('https://tbpl.mozilla.org/php/getRevisionBuilds.php?branch=try&rev='+ sys.argv[1]).read())

if len(builds) == 0:
  print "No bulids found for this revision"
  exit(1)

i = 0
for build in builds:
  name = build['buildername']
  print i, '/', len(builds), name
  i += 1
  name = name.replace(' ', '_')
  log = gzip.GzipFile(fileobj=StringIO(urllib2.urlopen(build['log']).read())).read()
  zips = re.findall("TinderboxPrint: Uploaded (profile_[a-zA-Z0-9-_]+\.zip) to ([^\n]+)", log)
  for zipp in zips:
    print ' ', zipp[0]
    try:
      os.mkdir(name)
    except OSError:
      pass
    with open(os.path.join(name, zipp[0]), 'w') as out:
      out.write(urllib2.urlopen(zipp[1]).read())
  print
