QA/Telemetry/Logging: Difference between revisions
Jump to navigation
Jump to search
| Line 6: | Line 6: | ||
You'll need to enable '''chrome and addon debugging''' under '''Developer Tools''' to get more details in the Browser Console. | You'll need to enable '''chrome and addon debugging''' under '''Developer Tools''' to get more details in the Browser Console. | ||
'''Note:''' You'll also need to add the | '''Note:''' You'll also need to add the '''experiments.logging.level;0''' preference under about:config for the logging information to correctly appear under the Browser Console. | ||
* Click the '''Open Menu''' on the right side of the browser and than click on '''Developer''' then '''Toggle Tools''' | * Click the '''Open Menu''' on the right side of the browser and than click on '''Developer''' then '''Toggle Tools''' | ||
Revision as of 16:20, 17 June 2014
Quick Summary
The following document will show users how to enable telemetry debugging logging and list other commands that can be used to retrieve logging information from the browser.
Enabling Logging
You'll need to enable chrome and addon debugging under Developer Tools to get more details in the Browser Console.
Note: You'll also need to add the experiments.logging.level;0 preference under about:config for the logging information to correctly appear under the Browser Console.
- Click the Open Menu on the right side of the browser and than click on Developer then Toggle Tools
- Once you have the Developer Tools opened, select Settings (the gear icon)
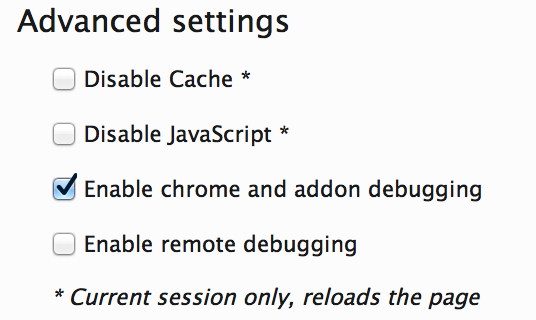
- Under Advanced Settings, you'll need to enable the following option:
- Select: Enable chrome and addon debugging

