Glossary
Redirect to:
Backfill
Trigger skipped jobs (Treeherder terminology). Also refers to filling in missing data points from Perfherder's Graphs view.
Data point
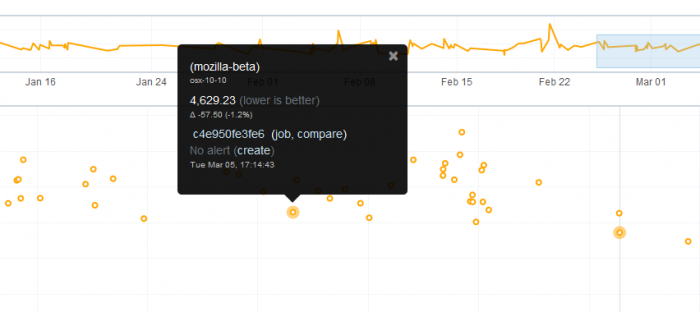
Performance metric value visible in Perfherder's Graph view.
DOM Content Flushed (dcf)
This is a Mozilla proprietary extension and not part of the performance/navigation timing specification. It marks the completion of the first presentation flush after DOMContentLoaded. Internal Firefox metric activated by setting the preference dom.performance.time_to_dom_content_flushed.enabled to true.
Downstream
Alert triggered by a commit that originally happened on another repo and was merged into the current one after.
First Contentful Paint (fcp)
First Contentful Paint (FCP) measures the time from navigation to the time when the browser renders the first bit of content from the DOM.
First Non-Blank Paint (fnbpaint)
The timestamp of a shipped frame that contains the first paint to draw more than the document background. Has low value to a user, as this paint may be completely meaningless or useless. The first non-blank paint is often represented as "Start Render" in performance products.
Gecko profile
The Firefox Profiler is a profiler that is built into Firefox and is available at profiler.firefox.com. It has tighter integration with Firefox than external profilers, and has more of a platform focus that the DevTools performance panel. It can be used a variety of situations where external profilers are not available, and can provide more information and insight into what the browser is doing.
mitmproxy
Mitmproxy is a third-party open-source tool (found here in github) that allows the recording of a live web page and saving it as a playback archive. Using Mitmproxy's 'mitmdump' tool, the recorded page can be played back through a local proxy browser proxy; then browsing to the URL loads the page from the mitmproxy recording instead of the live site.
The Raptor performance testing framework uses Mitmproxy for Raptor page-load performance tests. Mitmproxy is available as a python mozbase/mozproxy module for import in any python project.
Noise (regarding performance tests)
Generally a test reports values that are in a range instead of a consistent value. The larger the range of 'normal' results, the more noise we have. Some tests will post results in a small range, and when we get a data point significantly outside the range, it is easy to identify. The problem is that many tests have a large range of expected results. It makes it hard to determine what a regression is when we might have a range += 4% from the median and we have a 3% regression. It is obvious in the graph over time, but hard to tell until you have many future data points.
Perf Sheriff
Using perfherder, a perf-sheriff will perform these tasks:
- Look at the graph and determine the original branch, date, revision where the alert occurred
- Look at Treeherder and determine if we have all the data.
- Retrigger jobs if needed (more noise, more retriggers)
- Once you have more data, look at the data in compare view to see if other tests/platforms have changed
- Add all related alerts you see to the summary with the reassign button
Perfherder
Perfherder is an interactive dashboard intended to allow monitoring and analysis of automated performance tests run against Mozilla products (currently Firefox and Firefox for Android).
Raptor
Raptor is a performance testing framework used for running browser page-load and browser benchmark tests. Raptor can run performance tests on Firefox desktop, Firefox android (Fennec, Geckoview example app, and the android components Reference Browser), and Google Chrome/Chromium. For more information please refer to the Raptor wiki page.
RelMan glossary
These terms are of use, especially when doing Performance sheriffing.
Retrigger
Any run of the same job on the same commit for the same repo triggered after the first one. Retriggers usually happen when the available datapoint in the graph are not enough for the sheriff to determine the culprit.
SETA
SETA finds the minimum set of jobs to run in order to catch all failures that our automation has found in the recent past on Firefox development repositories. SETA creates job priorities for all jobs found in the runnable-jobs API for that repository.
Talos
Talos is our versatile performance testing framework we use at Mozilla. It was created to serve as a test runner for the existing performance tests that Mozilla was running back in 2007 as well as providing an extensible framework for new tests as they were created.
Treeherder
Treeherder is a reporting dashboard for Mozilla checkins. It allows users to see the results of automatic builds and their respective tests. The Treeherder service manages the etl layer for data ingestion, web services, and the data model behind Treeherder.
Time To First Interactive (ttfi)
This is a newer metric and reports when the page is first expected to be usable and will respond to input quickly (with the possibility of slow responses as more content loads).
- Start looking for First Interactive at first contentful paint
- Look for the first interactive window (with no regard to in-flight requests)
- First Interactive is the start of the interactive window from step 2, first contentful paint or DOM Content Loaded, whichever is later
R/b
Short name for retrigger/backfill.
WebPageTest
Accurately measure, track, and report on key Firefox-performance metrics, over time.
